美伊停火協議落地,全球風險資產迅速反彈,標普500自週一低點回升,油價創2020年來最大單日跌幅,VIX跌破20。但反彈之下暗流湧動:散戶逢漲減倉、CTA空頭接近歷史極值、95%標普成分股處於回購限制期。這場反彈是新多頭的起點,還是暴風雨前的寧靜?
⏱️ 一分鐘快速總結 (1-Minute Quick Summary)
📍 事件: 美伊停火 → 標普反彈、油價暴跌、VIX跌破20
📉 機構: CTA全球空頭$550億近歷史極值,空頭回補潛力巨大
🛒 散戶: 從「逢跌買入」轉為「逢漲減倉」,活躍度僅1.2%分位,唯一在買的是Mag7
😨 情緒: Bull/Bear Ratio 1.20(均值1.93),極度悲觀 = 逆向看漲
💰 財報&回購: Q1財報4/14開跑,預估+13.2%(科技+45.1%);回購授權$4,050億創新高,但95%成分股在限制期。
結論: 倉位極輕、情緒極差、財報在即——燃料備好,但地緣引信尚未點燃
Ceasefire rally: S&P 500 rebounded, oil posted its biggest drop since 2020, VIX fell below 20. But CTAs hold $55B in shorts near historic extremes, retail shifted to “sell the rip” (1.2nd percentile activity), and Bull/Bear hit 1.20 (contrarian bullish). Q1 earnings start Apr 14 (+13.2%, tech +45.1%); buyback auths at record $405B but 95% in blackout. Bottom line: fuel is there, geopolitical fuse remains unlit.
一、機構倉位全景:系統性策略與CTA持倉
根據高盛團隊最新估計,全球股票系統性多頭淨部位目前約為 1,800億美元(風險評級3.3/10),其中美國市場約佔1,000億美元。值得注意的是,CTA(趨勢追蹤策略)目前在全球持有約550億美元的空頭頭寸,其中近400億美元集中在美國市場,已接近歷史區間底部(約1–2.5/10)。
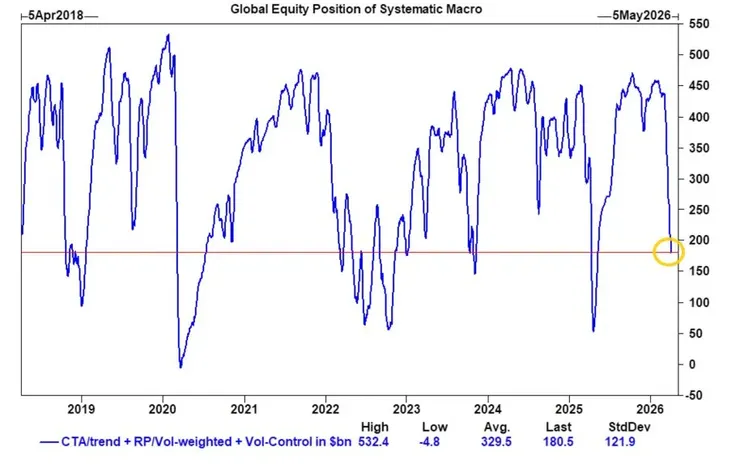
📌 作為參考,歷史上全球CTA最大空頭部位約為1,450億美元,美國最大空頭部位約為550億美元。當前水平已相當極端。
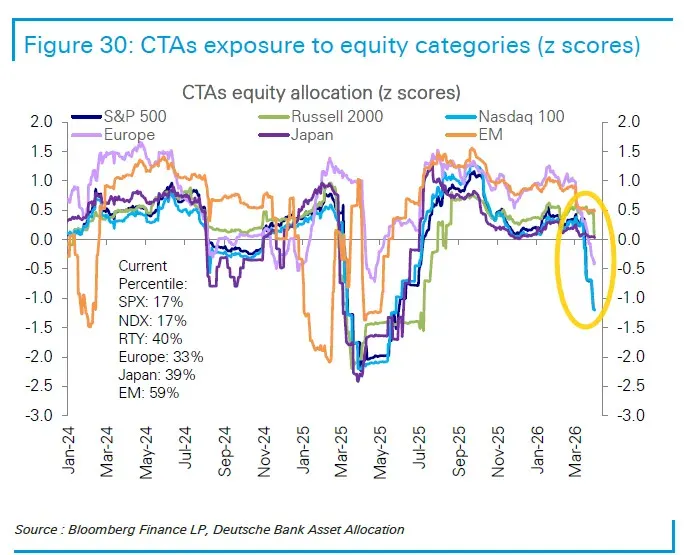
德意志銀行的數據進一步佐證了這一觀察:CTA在美國指數的持股比例已大幅下降——標普500及納斯達克100指數均降至第17百分位,羅素2000指數相對較高但也僅處於第40百分位。
從系統性宏觀策略的全局來看,當前的股票部位已壓縮至較低水平。這通常意味著,若市場出現方向性改善,存在大規模的空頭回補和倉位重建的潛力。
🔤 English Summary — Institutional Positioning & CTAs
Goldman Sachs estimates global systematic equity net long positioning at ~$180B (3.3/10 risk score), with U.S. exposure at ~$100B. CTAs now hold ~$55B in global short positions (~$40B in U.S. alone), near the historical floor (1–2.5/10). Deutsche Bank confirms CTA allocations to U.S. indices have dropped to the 17th percentile for both S&P 500 and Nasdaq 100. This extreme underweight implies significant short-covering and position-rebuilding potential should market direction improve.
二、散戶行為轉變:從逢跌買入到逢漲減倉
本週最引人注目的市場現象之一,來自摩根大通零售雷達報告所揭示的散戶行為模式劇變。停火消息引發市場反彈,但美國散戶投資者選擇了賣出而非追漲。
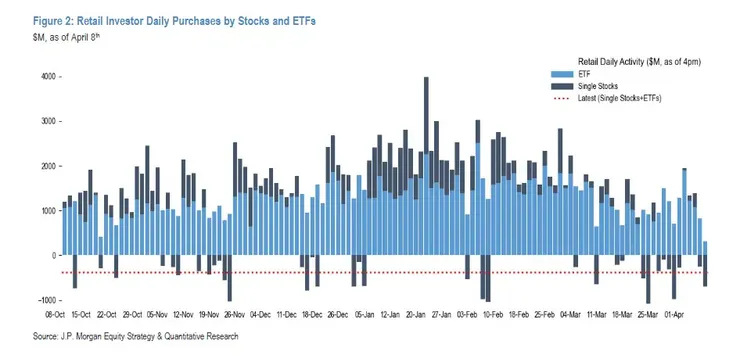
🔄 散戶行為模式已發生根本性轉變——從此前的「逢跌買入」,演變為如今的「逢漲減倉」,防禦傾向持續強化。本週散戶整體交易活動極度低迷,活躍度僅處於歷史 1.2%分位。
截至4月8日當週,散戶資金流入總量降至 48億美元,遠低於過去12個月周均66億美元的水平。儘管當日油價錄得2020年以來最大單日跌幅、VIX恐慌指數跌破20,市場情緒明顯改善,但散戶資金流入並未隨之回暖——盤中一度出現近一年來最大規模的ETF淨賣出,收盤時ETF持倉敞口降至逾10個月最低水平(0.4%分位)。
ETF層面:寬基遭拋、防禦偏好明顯
散戶對寬基股票ETF的買入量為近一年最低(z值-2.3),持續淨賣出SPY和TQQQ。板塊ETF方面,淨賣出規模同樣顯著(0.4%分位,z值-3.1),半導體三倍做多ETF SOXL遭到最大規模拋售。
散戶ETF資金流向:
🟢 買入方向:
- 固定收益多元板塊:+2.14億美元
- 大盤成長風格:+2.09億美元
- 多市值寬基:+1.92億美元
- 股息策略:+1.82億美元
🔴 賣出方向:
- 能源板塊:-0.98億美元
- 科技板塊:-0.81億美元
個股層面:Mag7仍是避風港
個股方面,散戶當日淨賣出覆蓋幾乎所有板塊,能源和工業領跌,通訊服務為唯一例外。然而,科技巨頭(Mag7)仍是為數不多的散戶淨買入方向:
散戶Mag7淨買入金額(億美元):
🟢 特斯拉 TSLA:+4.94
🟢 英偉達 NVDA:+2.98
🟢 微軟 MSFT:+2.82
🟢 META:+1.40
🟢 蘋果 AAPL:+1.00
🟢 谷歌 GOOGL:+0.62
🔴 亞馬遜 AMZN:-0.36
其中META獲得額外資金流入,部分原因在於其超級智能團隊發布了新模型。
散戶與機構的分歧
摩根大通數據顯示,非散戶投資者上週淨賣出85億美元(高於過去12月均值73億美元),而期貨交易者則淨買入約52億美元,主要由標普500期貨(ES,約18億美元)和納斯達克100期貨(NQ,約34億美元)驅動,與散戶的防禦性操作形成一定分化。
🔤 English Summary — Retail Investor Behavior Shift
J.P. Morgan’s Retail Radar shows a fundamental shift in U.S. retail behavior: from “buy the dip” to “sell the rip.” Despite the ceasefire rally, retail activity hit the 1.2nd percentile historically. Weekly inflows dropped to $4.8B (vs. $6.6B 12-month average), with ETF exposure falling to a 10-month low (0.4th percentile). Retail investors heavily sold broad-based equity ETFs (SPY, TQQQ) and sector ETFs (especially SOXL), while favoring fixed income and dividend strategies. Among individual stocks, Mag7 names remained the only consistent net-buy — led by Tesla ($494M), Nvidia ($298M), and Microsoft ($282M). Meanwhile, futures traders were net buyers of ~$5.2B, creating a notable divergence from retail’s defensive posture.
三、情緒指標與逆向訊號
停火消息確認了此前的判斷——標普500指數已於週一觸底。然而,從情緒指標來看,市場的悲觀情緒依然濃厚。
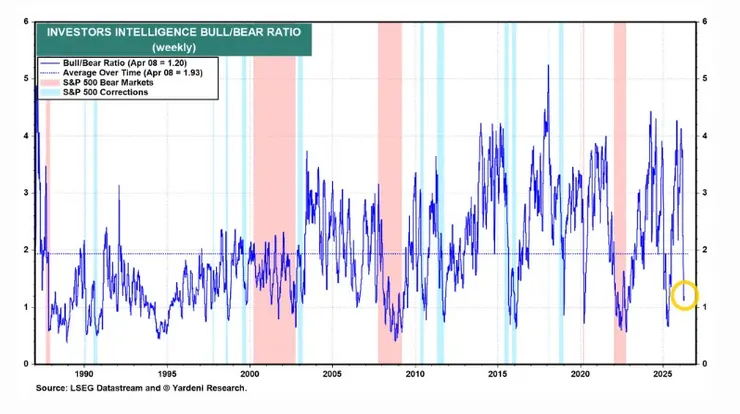
Investors Intelligence多空指數(Bull/Bear Ratio)截至4月8日讀數為 1.20,遠低於歷史平均值1.93,顯示看空情緒已達到極端水平。從逆向投資角度來看,這反而是看漲訊號。
📊 然而需注意,兩週的暫停並不意味著問題得到解決。金融市場仍將對談判破裂的任何跡象保持高度敏感。
🔤 English Summary — Sentiment & Contrarian Signals
The Investors Intelligence Bull/Bear Ratio fell to 1.20 as of April 8 — well below its historical average of 1.93 — signaling extreme bearish sentiment. From a contrarian perspective, this is actually a bullish indicator. However, the two-week ceasefire is a pause, not a resolution; markets remain highly sensitive to any signs of negotiation breakdown.
四、Q1財報季前瞻
第一季財報將於4月14日由摩根大通正式拉開序幕。目前市場共識預計標普500指數Q1獲利成長率為 13.2%,高於年初時的12.8%預估。
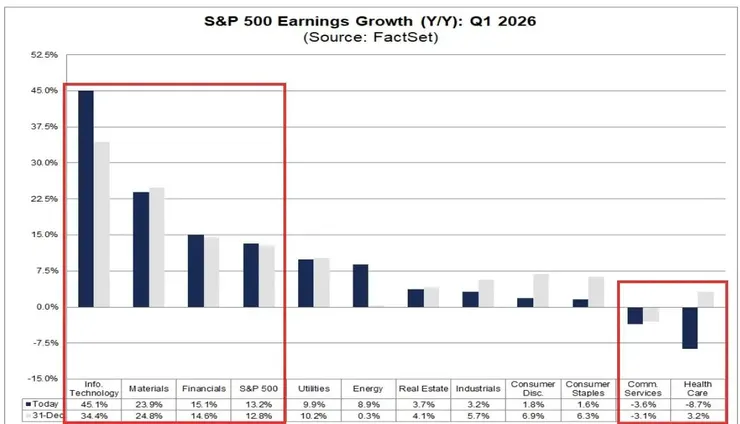
各板塊盈利成長率(同比):
🥇 科技(領漲):+45.1%
🥈 原物料:+23.9%
🥉 金融:+15.1%
📊 標普500整體:+13.2%
⚡ 公用事業:+9.9%
🛢️ 能源:+8.9%(伊朗衝突前曾跌至-8.2%)
🏠 不動產:+3.7%
🏭 工業:+3.2%
🛍️ 非必需消費:+1.8%
🛒 必需消費:+1.6%
📡 通訊服務:-3.6%
🏥 醫療保健:-8.7%
科技板塊依然是成長的絕對領頭羊,年增高達45.1%。能源板塊在伊朗衝突爆發前一度下跌至-8.2%,目前已回升至+8.9%。通訊服務和醫療保健板塊預計將出現同比負成長。
🔤 English Summary — Q1 Earnings Preview
Q1 earnings season kicks off April 14 with J.P. Morgan reporting first. Consensus expects S&P 500 earnings growth of 13.2% YoY (up from 12.8% at year-start). Tech leads at an impressive +45.1%, followed by Materials (+23.9%) and Financials (+15.1%). Energy recovered from -8.2% to +8.9% post-Iran conflict. Communication Services (-3.6%) and Healthcare (-8.7%) are the only sectors projected to decline.
五、回購動態與資金面
高盛預計,股票回購規模將從上週強勁的1.3倍同比回落至1.0倍。回購限制期可能是主要原因——限制期通常會導致回購規模減少約30%,而目前標普500指數成分股中有 95% 處於限制期。
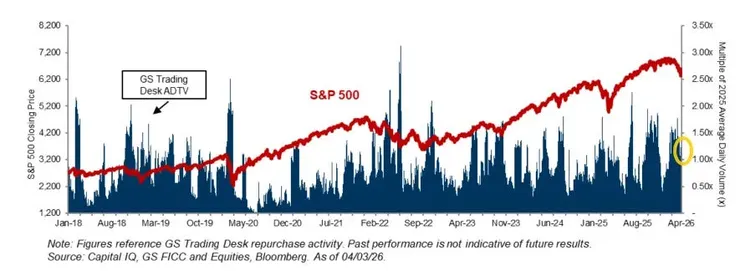
💰 在授權方面,2026年迄今的回購授權額已達 4,050億美元,是迄今為止最活躍的時期,顯示企業對自身股票價值的長期信心未改。
🔤 English Summary — Buyback Dynamics
Goldman Sachs expects buyback activity to ease from 1.3x YoY last week to 1.0x, largely due to the blackout period — 95% of S&P 500 constituents are currently restricted, which typically reduces repurchase volume by ~30%. On the authorization side, 2026 YTD buyback authorizations have reached $405B, making this the most active period on record — a signal of strong corporate confidence in long-term equity value.
六、相關性飆升與伊朗衝突效應
伊朗局勢引發的市場衝擊使大盤股的隱含相關性急劇攀升。標普500最大成分股的1個月50 Delta隱含相關性一度飆升至40點附近,隨後伴隨停火消息有所回落,但仍處於相對高位。
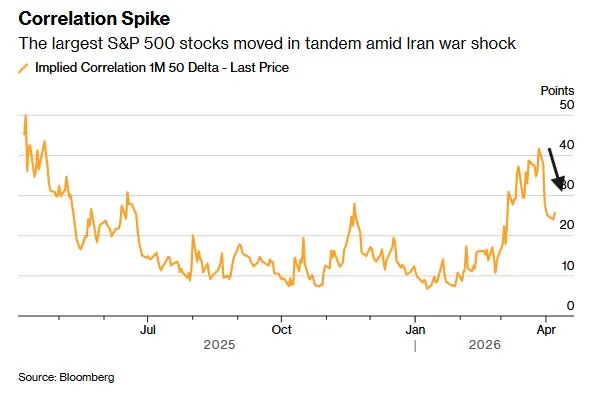
高相關性意味著市場仍在以「風險開/關」(risk on/off)模式運作,個股alpha機會受到壓縮,系統性風險仍是主導因素。
🔤 English Summary — Correlation Spike & Iran Effect
The Iran conflict triggered a sharp spike in implied correlation among the largest S&P 500 stocks, with 1-month 50-delta implied correlation surging to ~40 points before easing on ceasefire news. Elevated correlation indicates the market is still trading in a binary “risk on/off” regime, compressing single-stock alpha opportunities and keeping systematic risk as the dominant driver.
七、本週展望與風險提示
綜合以上各方面的數據與訊號,可以歸納出以下關鍵要點:
🟢 看多因素(Bullish):
- CTA和系統性策略倉位處於歷史低位,空頭回補潛力巨大
- 情緒指標極度悲觀,從逆向投資角度具有看漲意義
- Q1財報預期穩健,科技板塊成長強勁
- 2026年回購授權額創歷史新高
🔴 看空因素(Bearish):
- 散戶已轉向「逢漲減倉」模式,對反彈持續性持懷疑態度
- 兩週停火僅是暫緩而非解決,地緣風險仍在
- 95%的標普500成分股處於回購限制期,短期資金面承壓
- 高相關性環境顯示市場仍受系統性風險主導
本週關鍵事件為4月14日摩根大通率先公布的Q1財報。市場將密切關注銀行業對經濟前景的評估,以及企業對地緣政治風險和貿易政策的前瞻性指引。與此同時,任何停火談判破裂的跡象都可能引發市場劇烈波動。
🔤 English Summary — Weekly Outlook
The bull case rests on historically depressed CTA/systematic positioning (massive short-covering potential), extreme bearish sentiment as a contrarian buy signal, solid Q1 earnings expectations (tech +45.1%), and record-high buyback authorizations ($405B YTD). The bear case centers on retail’s shift to “sell the rip” behavior, the fragile two-week ceasefire leaving geopolitical risk unresolved, 95% of S&P 500 names in buyback blackout, and elevated correlation signaling persistent systematic risk. Key event: J.P. Morgan kicks off Q1 earnings on April 14.
⚠️ 本報告僅供參考,不構成任何投資建議。投資有風險,入市需謹慎。 This report is for informational purposes only and does not constitute investment advice.
資料來源 / Sources:Goldman Sachs, J.P. Morgan, Deutsche Bank, FactSet, Bloomberg, Yardeni Research


